1 Introduction
As a light source of fiber laser sensor, narrow linewidth fiber laser has the characteristics of interference to electromagnetic field, safety, small size and remote control. Currently, there are three schemes for obtaining single longitudinal mode narrow linewidth fiber lasers. 1) Non-coherent technology that eliminates spatial hole burning caused by standing wave effect by controlling the polarization state of the encountering light waves in the cavity; 2) adding unpumped doped fiber in the laser cavity to select the frequency and suppressing the saturated absorption of the mode-hopping Body; 3) short cavity fiber laser, including DFB fiber laser and short cavity DBR fiber laser. Comparing the three schemes, it is found that schemes 1 and 2 require the use of multiple polarization controllers, and most of them have annular cavity structures, which are difficult to control, low conversion efficiency, and extremely low output power; while scheme 3 has a simple structure, the output power exceeds 200mW, and the slope The efficiency is 24, and the difficulty lies in how to use a pumping method to achieve high output power on short gain fibers, and how to achieve special packaging. Ultra-short-cavity DBR structure fiber lasers have also been studied in China, but the laser has low efficiency, the maximum output power is only 11mW, and the line width is limited in the MHz range.
In this paper, a highly fiber-doped Er3 + linear cavity narrow linewidth fiber laser with dual fiber grating Berry-Perot (FBG F-P) cavity mode selection is developed. The fiber laser combines non-coherent technology, high output power, high energy conversion efficiency, extremely narrow line width, and has the characteristics of simple structure, all-fiberization and high signal-to-noise ratio, which can be applied to high-precision fiber sensing systems.
2 Narrow linewidth fiber laser experimental results
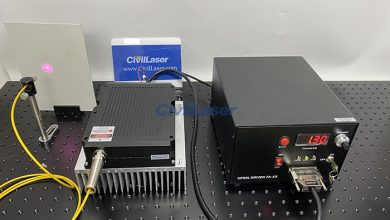
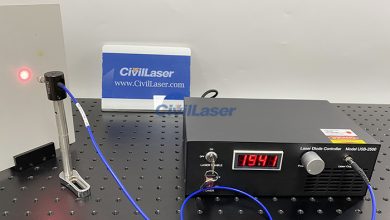
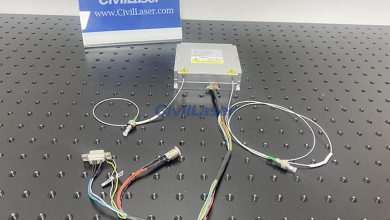
The fiber laser is mainly composed of two FBG F-P cavities and highly doped Er3 + fiber linear cavities. The experimental setup is shown in Figure 1. The gain medium of the laser is a highly doped Er3 + fiber with a length of 3m, a peak absorption coefficient of 17 dB / m at a wavelength of 978nm, and a peak absorption coefficient of 30 dB / m at a wavelength of 1 550 nm. In the experiment, a bidirectional pumping method was used. The pumping light source was an LD with a center wavelength of 976nm. The maximum pumping powers of LD 1 and LD 2 were 76mW and 69mW, respectively. Due to the spatial hole burning effect in the linear cavity structure, which causes multi-longitudinal mode oscillation, the use of a Faraday rotator (FR) with an all-fiber structure can change the polarization state of the round-trip beam through it by 90 °, thereby destroying the fiber laser. The standing wave formation conditions can suppress the effect of space hole burning.
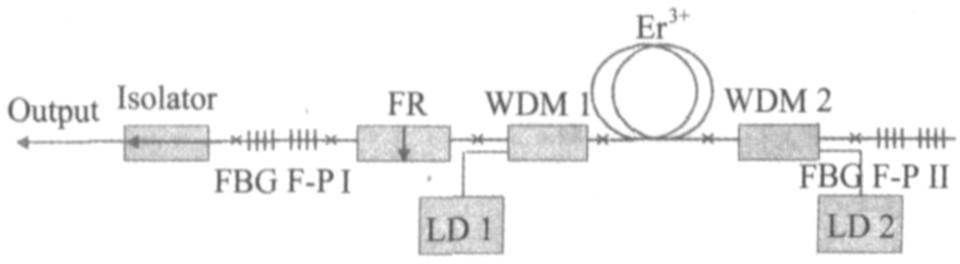
Fig.1: Experimental setup of narrow linewidth fiber laser
The structure of the FBG F-P cavity is shown in Figure 2. The FBG F-P cavity is etched on a common single-mode fiber, the distance between the gratings is 1 cm, and the total cavity length does not exceed 5 cm. The FBG F-P cavity reflection spectrum measured with a bandwidth AS E light source is shown in Figure 3. FBG F-P Ⅰ is composed of 2 FBGs with a reflectance of 50, with a total reflectance of 80; FBG F-P Ⅱ is composed of 2 FBBs with a reflectance of 80, and the total reflectance is 99. In the experiment, the FBG F-P cavity functions as a cavity mirror and as an inserted F-P cavity mode selection, which is conducive to the realization of all-fiberization of the laser. The number of output spectral lines of the FBG FP cavity is determined by the cavity length of the FP cavity and the reflection bandwidth of the FBG. The shorter the cavity length of the FBG FP cavity, the larger the output line spacing, the narrower the reflection bandwidth of the FBG, and the FP cavity can hold. The smaller the number of modes, the better the frequency-selective characteristics than ordinary FP cavity. Finally, due to gain saturation, in the mode competition of a few longitudinal modes, a single longitudinal mode of the center frequency is dominant, and a single longitudinal mode laser output is finally obtained.
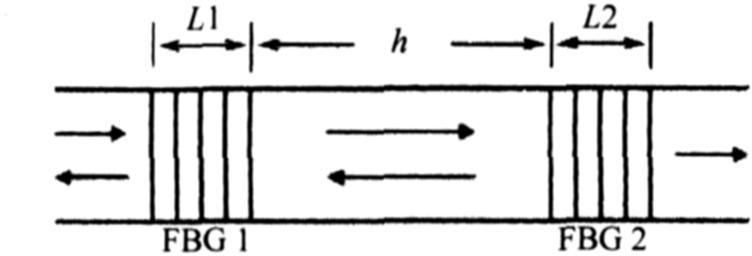
Fig.2: Schematic diagram of FBG F-P cavity
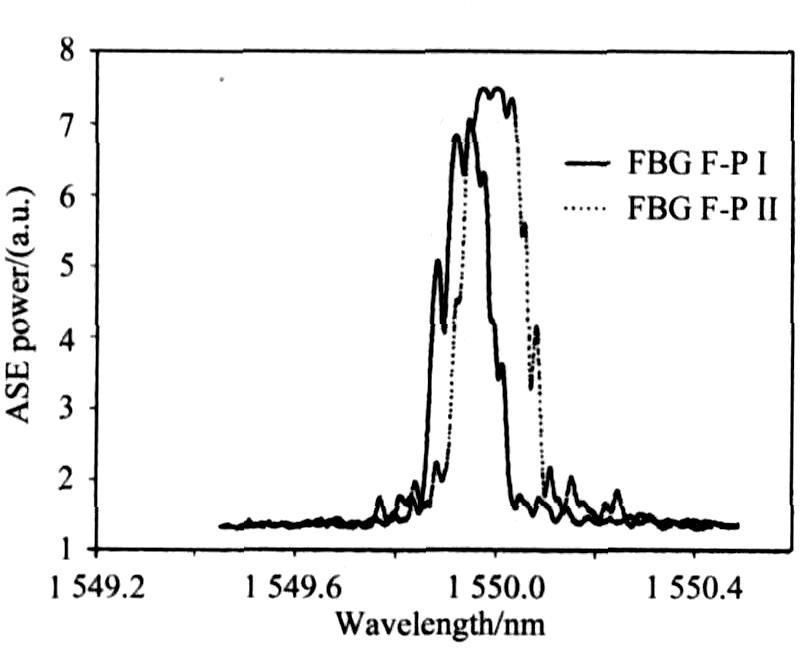
Fig.3: Reflectivity spectrum of FBG F-P cavity
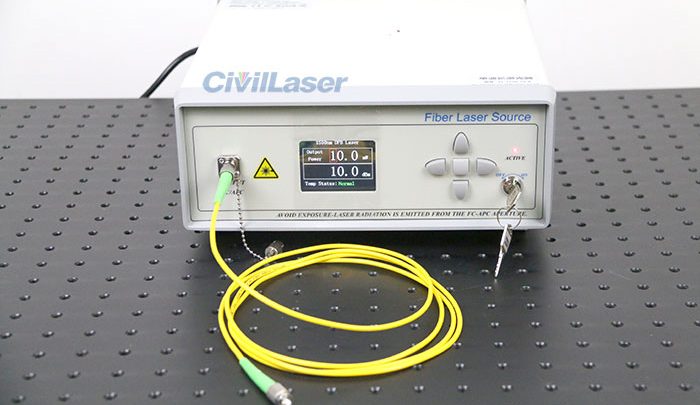
The Ando6319 spectrum analyzer was used to record the experiments. The highest precision of the spectrometer was 0.01 nm. The output optical power is accurately measured with an optical power meter. When the pumped optical power is 11 mW, the laser starts to vibrate. With the increase of pumping power, stable spectral lines begin to be obtained, and the 3 dB line width of the spectral line is not affected by the increase of pumping optical power. Figure 4 shows the output spectrum with a scanning range of 5 nm and an accuracy of 0.01 nm. The output laser of the analytical spectrometer has a center wavelength of 1 550 nm, 3 dB
The line width is less than 0.01 nm, and the signal-to-noise ratio is greater than 50 dB. After 1 h of continuous observation, no mode-hopping phenomenon occurred in the laser, and the wavelength drift range was less than 0.01 nm. When the pumped optical power is a maximum of 145 mW, the output power is 73 mW, the light-to-light conversion efficiency is 50, and the slope efficiency is 55. Figure 5 shows the output power as a function of pumping power. It can be seen from the figure that the output power changes linearly with the increase of pumping power.
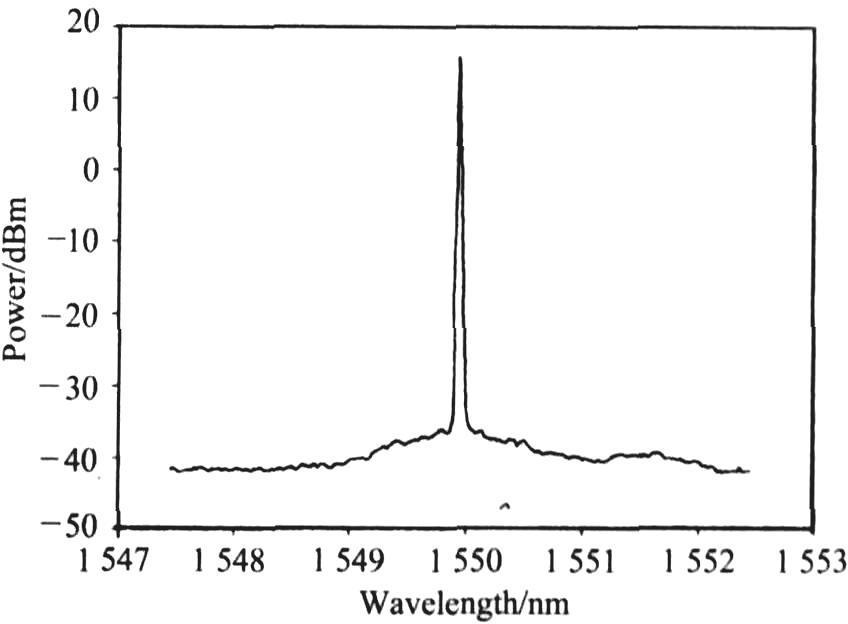
Fig.4: Output narrow line-width spectrum of fiber laser
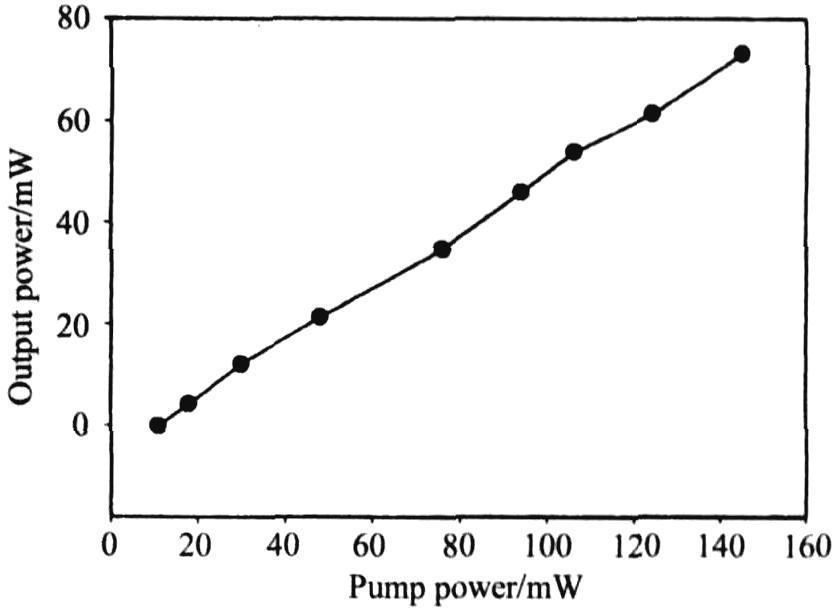
Fig.5: Output power vs.pump power
3 Experimental results of self-heterodyne line width measurement
At present, the measurement of the line width of a kHz-level laser has a delayed self-heterodyne / zero-difference spectrometry method. Compared with the self-heterodyne method, although a frequency shifter is not required, it cannot be measured directly with a standard RF spectrum analyzer. The improved self-heterodyne measurement system [15] needs to add a phase modulator and a local RF oscillator, which is more complicated than the self-heterodyne measurement system. In order to obtain accurate laser line width, the fiber laser line width was measured using the delayed self-heterodyne method.
The experimental system of the delayed self-heterodyne method is shown in Figure 6. The entire experimental system consists of a 10 km single-mode fiber delay line, an acousto-optic frequency shifter with a center frequency of 70 MHz, two 1 × 2 3 dB fiber couplers, a photodetector, and an AD-VANTEST R3267 RF spectrum analyzer . The measurement accuracy of the delay self-heterodyne measurement method is related to the length of the fiber delay line [16]. According to calculations, the measurement accuracy of a 10 km fiber delay line is 10 kHz. The laser linewidth measurement results are shown in Figure 7. The 3 dB bandwidth of the spectral line obtained by the RF spectrum analyzer is 5 kHz. Due to the limitation of measurement accuracy, the 3 dB linewidth of the fiber laser is considered to be less than 10 kHz.
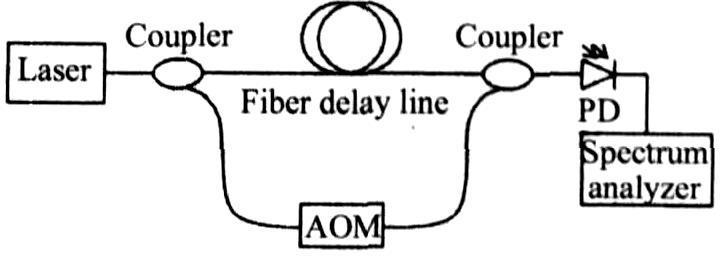
Fig.6: Experimental setup for delayed self-heterodyne measurement
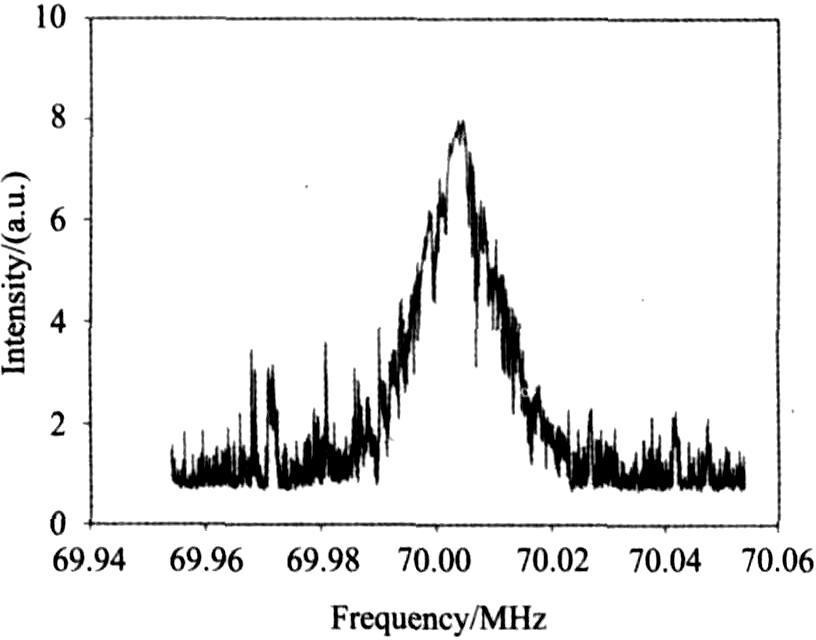
Fig.7: The heterodyne signal measured at 10 km delay fiber
4 Conclusion
Combined with non-coherent technology, the use of all-fiber FR to suppress the effect of spatial hole burning, through the selection of two short FBG F-P cavity mode, a single longitudinal mode narrow linewidth fiber laser was developed. The power output characteristics are given. The threshold pumped optical power is 11mW, the output signal optical power is 73mW, and the slope efficiency reaches 55. The output wavelength of the laser is 1550nm, the spectrum is stable, and the signal-to-noise ratio is high. A 10km single-mode fiber delay line was used to measure the delay self-heterodyne line width. Due to the limitation of measurement accuracy, the 3 dB line width of the fiber laser was finally less than 10kHz.